
One transcription site advertises accuracy in the high nineties. A benchmark reports a word error rate around ten percent. Another leaderboard shows a leading speech engine near two percent.
It is tempting to put those figures in one table and sort. The table would look decisive. It would also hide the most important differences: what was recorded, how it was transcribed and what counted as an error.
We ran into this while reviewing Podtyper’s full-episode podcast results. We wanted to know whether the numbers looked competitive. The published evidence offered useful context, but not a defensible app ranking.

We make Podtyper. This guide draws on our own experiment and linked public sources checked on 27 October 2026. We have not run a controlled comparison through the other apps discussed here.
First ask what kind of claim you are reading
There are at least four different things commonly described as transcription accuracy:
| Evidence | What it can tell you | What it leaves open |
|---|---|---|
| Product accuracy claim | How the vendor describes its product | The shared test files, scoring rules and distribution of results |
| App comparison on common files | Relative performance in that test’s product workflows | New versions, other audio and the effect of different plans or settings |
| Speech-engine benchmark | API or model performance under a specified protocol | The behavior of a consumer app built around the engine |
| A product’s own retained evaluation | What happened in the disclosed runs | Independence, representativeness and performance outside the sample |
Each can be useful. The mistake is treating them as interchangeable observations.
Reduct’s comparison is an app study with a date attached
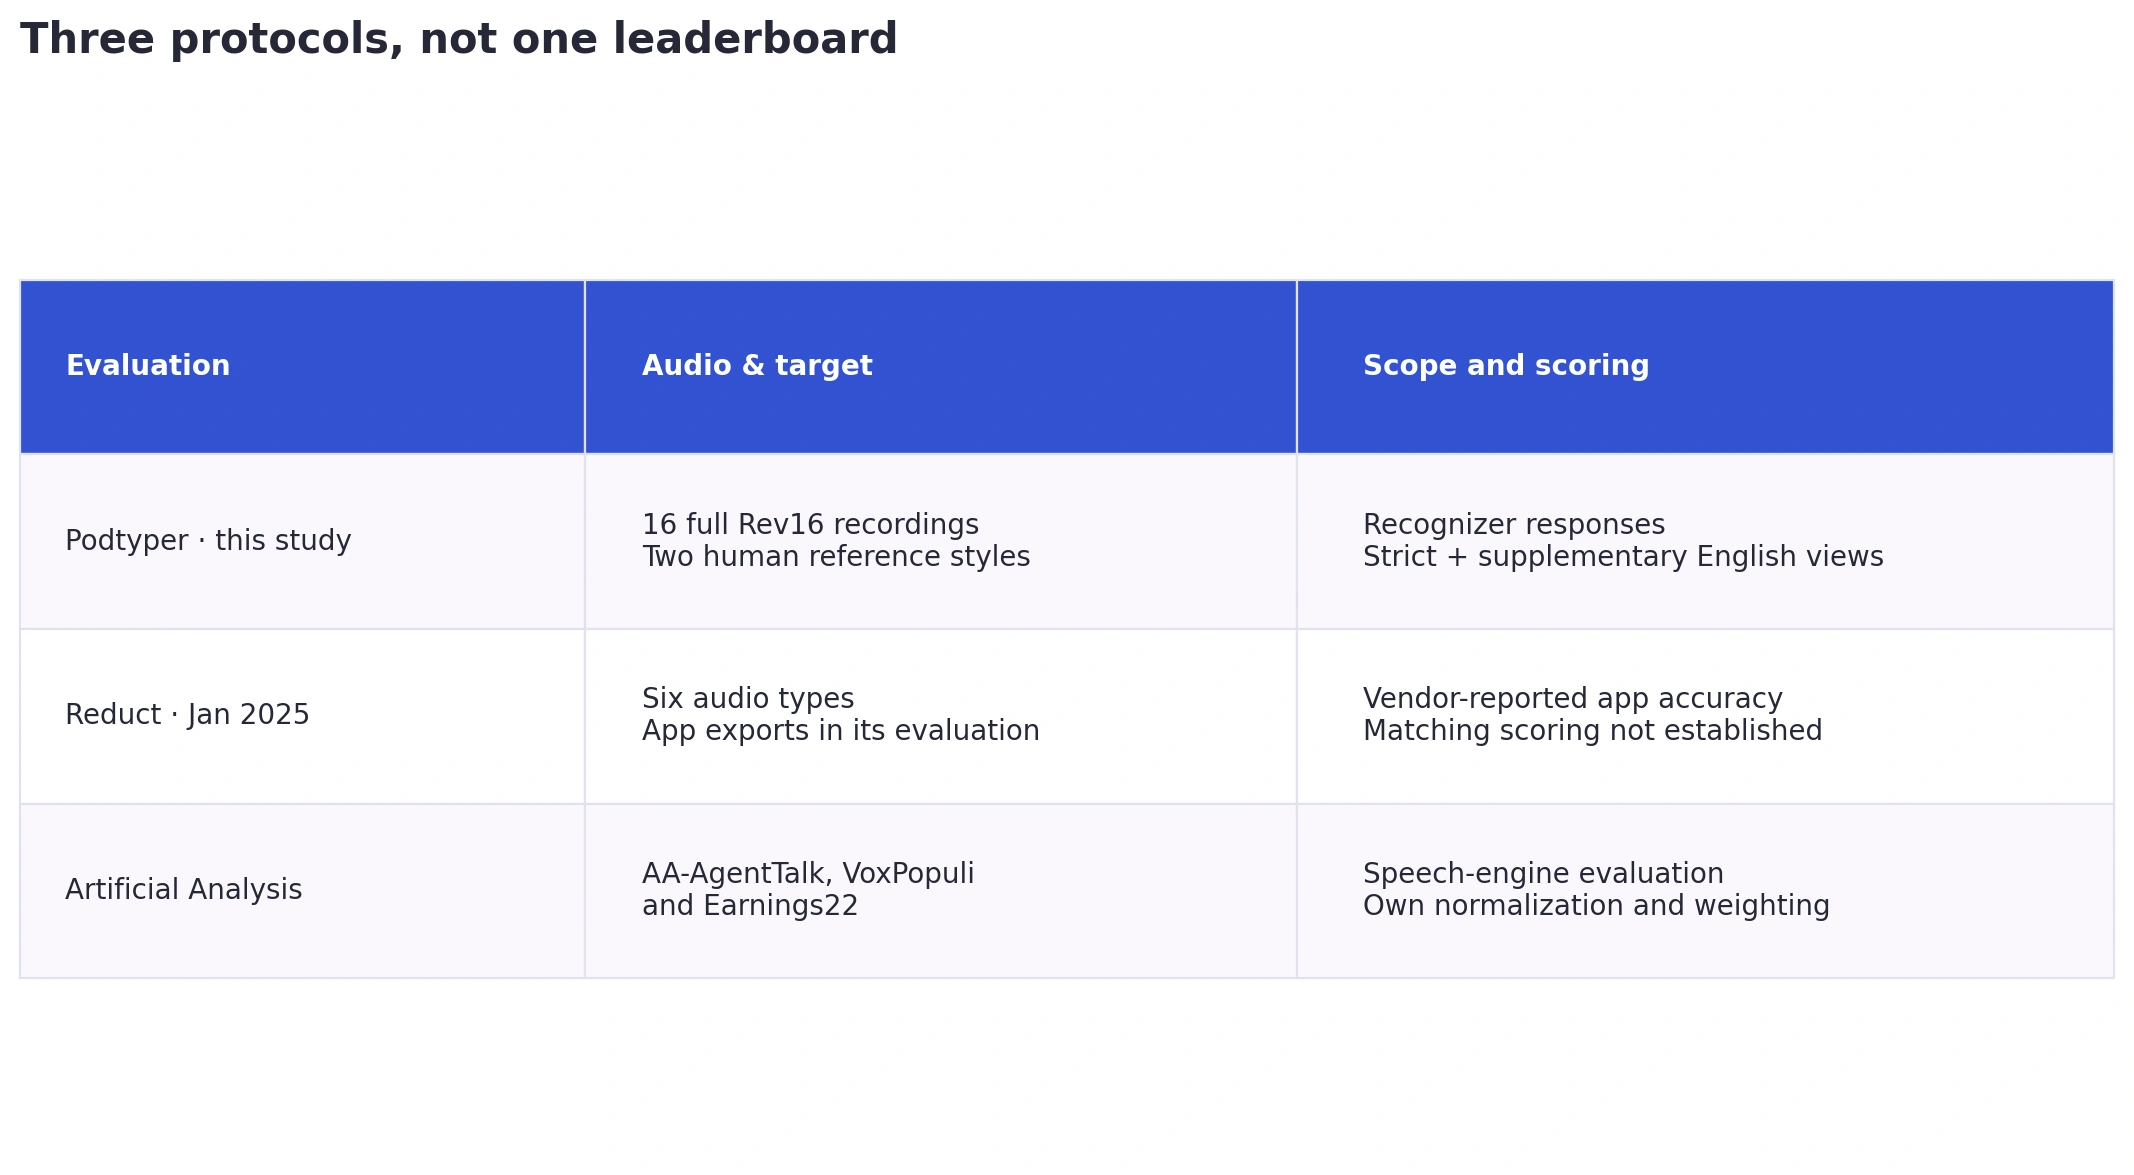
Reduct’s benchmark reports average accuracy across six audio types. The page is labelled January 2025. Reduct sells a competing transcription and video product, so this is a vendor-run evaluation.
Some of the averages it reports are:
| App | Accuracy reported by Reduct |
|---|---|
| Reduct | 94.92% |
| Sonix | 92.83% |
| Descript | 92.18% |
| Rev | 89.80% |
| Otter | 89.30% |
These are historical results in Reduct’s metric. We have not established that its scoring implementation matches ours. They should not be read as fresh October 2026 measurements of those apps.
The study is useful because it compares apps within its own test. It does not supply a place for Podtyper’s independently measured score. Turning our normalized WER into an “accuracy percentage” and inserting it between these rows would imply a shared experiment that never happened.
Even the same dataset name is not enough
AssemblyAI’s benchmark page has a prerecorded Rev16 column. In the 14 October 2026 snapshot we checked, that column reports normalized verbatim WER of 9.8% for Speechmatics Enhanced, 9.9% for AssemblyAI Universal-3.5 Pro and 10.7% for Deepgram Nova-3.
Our own supplementary normalized verbatim figure is 8.29%. The dataset name makes these results more relevant than a clean read-speech score, but it still does not establish a head-to-head win. Reference versions, file selection, request conditions, model snapshots and aggregation need to match too. AssemblyAI also sells a competing engine and ran its evaluation.
There are separate streaming results and subset protocols on benchmark sites. Selecting a convenient prerecorded column does not establish the best score another engine can achieve.
An external engine table can help decide what to test next. To claim superiority over an app, we would still need to test that app.
A different corpus can produce a very different error rate
Artificial Analysis’s methodology describes a separate speech-to-text index using AA-AgentTalk, VoxPopuli and Earnings22. It has its own normalization and weighting rules. Those choices make its figures useful within that evaluation; they do not predict a score on our Rev16 recordings.
Think of a podcast with casual speech, a controlled speech task and an earnings call. They can stress a recognizer in different ways. Length, recording quality, vocabulary and speaking style can all change the error profile before the scorer gets involved.
Normalization changes the definition of a match
Numbers, contractions, punctuation and filler words can be handled differently. An edited reference introduces another choice. We measured this directly: the same metadata-hint output scored 10.18% under our original verbatim rules and 8.29% under the supplementary English normalizer.
Neither number should travel without its label. Our WER explainer shows why the reference-word denominator can change as well.
Aggregation needs the same scrutiny. A mean across audio categories, a word-weighted corpus score and a weighted index across datasets do not necessarily give the same influence to a long difficult recording. The word “average” is not enough to tell you which was used.
Apps also solve different jobs
Accuracy is only one dimension of choosing software. Descript’s transcription product connects transcripts with an audio and video editing workflow. Otter’s accuracy guidance discusses meeting capture and variation with noise, accents and conversation complexity. A listener reading a published episode and a producer cutting an interview may need different features even if their raw transcripts have similar word scores.
For Podtyper, a fair recommendation should explain the podcast-reading workflow and its limits. It should also acknowledge when editing media, capturing a live meeting or obtaining human transcription makes another tool a better fit. Our podcast transcription tools guide compares documented workflows separately from this accuracy research.
What a fair shared app test would look like
Start with the task. Choose representative recordings before seeing any outputs, and freeze the references and scoring rules. Give every app the same source audio through its actual supported workflow. An API result labelled with a consumer app’s name would answer a different question.
Run a common condition without hints, then disclose a second condition using each product’s context features where available. Our keyword experiment is a reason to track name precision as well as recall. A glossary should not become an undisclosed advantage for one product.
Keep AI-only output separate from paid human transcription. Record service tiers, dates, failures and unedited exports. Report each recording as well as a combined score. If you want to compare correction time, measure it using a defined editing task; a WER value is not a measurement of minutes saved.
Then sort by the criterion you actually measured. A WER ranking should come from the shared test. A price table should specify usage and plan assumptions. A workflow recommendation should explain the reader’s task rather than disguise an editorial preference as a universal numerical rank.
What we can say about Podtyper today
The long-form result is enough to justify further comparison. It does not establish that Podtyper beats the apps above.
Our next useful evidence would be a shared app experiment with retained exports, consistent scoring and names checked separately. Until then, the honest comparison is a comparison of evidence: what each source tested, when it tested it and how far its conclusions can travel.
The series results file records our figures and source scope. The original benchmark kit preserves the underlying evaluation. Neither includes newly measured competitor-app outputs, because we have not produced them.